Band 6.0 IELTS Writing Task 1 Model Answer
Overall Band Score: 6.0 · Cambridge IELTS 16 · 2026-11-19
IELTS Writing Task 1 question
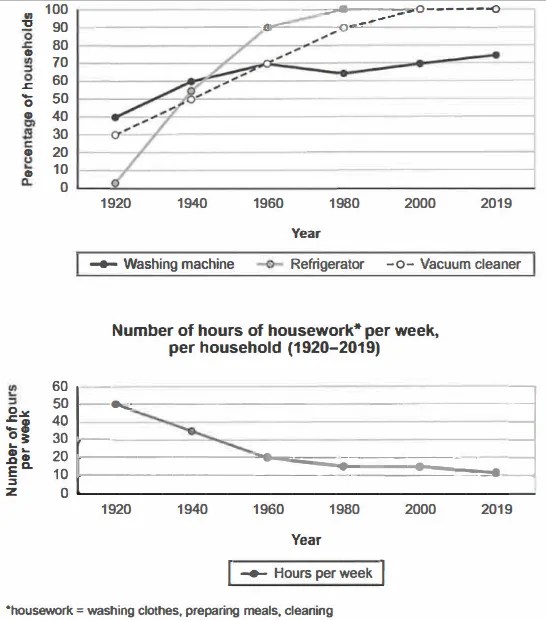
The charts below show the changes in ownership of electrical appliances and amount of time spent doing housework in households in one country between 1920 and 2019.
Summarise the information by selecting and reporting the main features, and make comparisons where relevant.
Percentage of households with electrical appliances (1920-2019)
Student answer (Band 6.0)
The given line graphs illustrates the differences in number of ownership of electrical appliances while the other depicts the amount of time spent doing household chores in one country between 1920 and 2019.
Overall, with the technical development of electrical appliances, the time spent doing housework reduced whereas people who owned such electrical appliances had increased rapidly over the decades.
In 1920, people spent around 50 hours a week to complete their household tasks, however it followed a negative trend and stood lowest at 10 hours a week in the year 2019. Whereas in thez same time period, vacuum cleaner began with the share of 40 percentage of total household whereas refrigerator commenced at 0 in the year 1920. In addition, this appliance had a positive steep curve and covered all the households and stood by the end of the chart. While in the meantime, Washing machine had positive trend and fluctation while growing however stood at little more than 70% in the year 2019
AI examiner evaluation
| Criterion | Band |
|---|---|
| Task Achievement / Task Response | 6.5 |
| Coherence and Cohesion | 6.0 |
| Lexical Resource | 6.0 |
| Grammatical Range and Accuracy | 5.5 |
| Overall | 6.0 |
Task Achievement / Task Response: Band 6.5
You identify the two broad trends accurately: appliance ownership generally rose, while weekly housework fell from about 50 hours to around 11. The overview is relevant, and you include some endpoint information. However, several details are inaccurate or unclear: the vacuum cleaner began at about 30%, not 40%, and the refrigerator started at about 2%, rather than 0%. The statement that the refrigerator “covered all the households” is not anchored to a year, and the washing-machine figures are only loosely described despite the dip around 1980. The response therefore covers the main task, but some features are less fully and precisely reported. To strengthen it, compare the three appliances across key years and state the refrigerator and vacuum cleaner’s eventual 100% levels clearly.
Coherence and Cohesion: Band 6.0
The response has a recognisable structure: an introduction, an overview and a body paragraph, and the main contrast between rising appliance ownership and falling housework time is easy to identify. This gives the report an overall coherent arrangement. However, progression within the body is less controlled. The long final paragraph moves from housework to vacuum cleaners, refrigerators and washing machines without clear separation, and connectors such as “Whereas,” “In addition,” and “While in the meantime” are sometimes awkward or leave relationships between ideas unclear. The overview also repeats the general trend rather than previewing the most important comparisons. Grouping the housework figures separately from appliance data, then comparing appliance trends in a logical order, would make cohesion more natural and precise.
Lexical Resource: Band 6.0
You use a reasonable range of task-related vocabulary, including “negative trend,” “positive,” “reduced,” and “fluctuation,” and the reader can generally understand the intended comparisons. There are also attempts at more formal phrasing, such as “commenced” and “stood.” However, some choices are inaccurate or unnatural for describing charts: “number of ownership” and “covered all the households” do not express the intended ideas clearly, while “positive steep curve” is an awkward collocation. “Fluctation” is also misspelled, and “appliance” is used ambiguously when referring to the refrigerator. Aim for precise chart language such as “the proportion of households owning…” and “reached 100%,” and use “share” or “percentage” consistently.
Grammatical Range and Accuracy: Band 5.5
You attempt a mix of simple and complex structures, including the overview clause beginning “whereas” and the sentence describing the housework trend. The overall meaning is usually recoverable, but some grammatical errors reduce accuracy. The opening has subject–verb disagreement in “graphs illustrates,” and “people spent around 50 hours a week to complete” uses an awkward infinitive construction. The sentence beginning “In 1920” is joined with “however” without suitable punctuation, while “Whereas in the same time period…” is a fragment rather than a complete sentence. The final sentence also lacks a clear grammatical structure. Build shorter, complete comparisons first, then combine them with accurate clauses; check agreement, sentence boundaries and punctuation.
See this exact question answered at other band scores. The same prompt compared across bands.
Browse more IELTS Writing model answers or get your own writing scored by the same AI examiner.