Band 5.5 IELTS Writing Task 1 Model Answer
Overall Band Score: 5.5 · Cambridge IELTS 16 · 2026-11-20
IELTS Writing Task 1 question
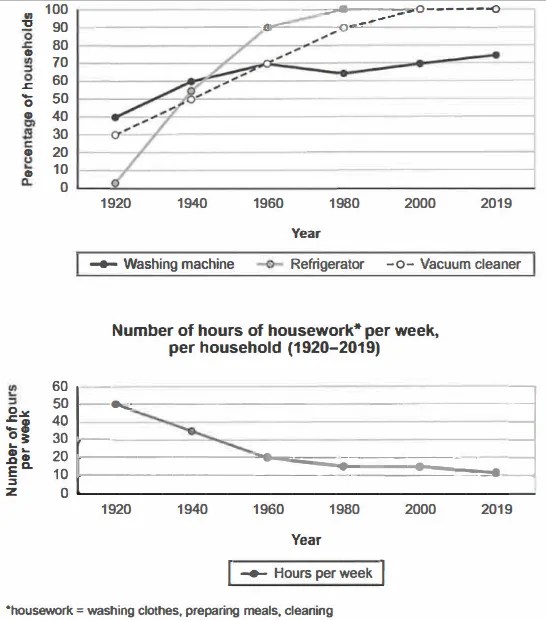
The charts below show the changes in ownership of electrical appliances and amount of time spent doing housework in households in one country between 1920 and 2019.
Summarise the information by selecting and reporting the main features, and make comparisons where relevant.
Percentage of households with electrical appliances (1920-2019)
Student answer (Band 5.5)
The given two charts illustrates the changes hands of electrical gadget and how much time spent doing housework in households in one nation between 1920 and 2019.
Overall , in first charts it can be seen households such as washing machine , refrigerator and vacuum cleaners trends grow respectively.
washing machine and refrigerator has highest ownership over the period while vacuum cleaner has lowest owner. in the second chart showed number of hours of housework per week. and the trends go down over the timeline.
In first chart, washing machine has 40 percent of households in 1920. before the growing 70 percent in 1960, it touch 60% og housholds in 1940. after that it number droped at 65 percent by 1980. and rose in year 2000 and touch again 70%. and it reached his highest percentage of households at around 73% by the end of time period. refrigerator has no ownerships in the year 1920. after that in 1940 it has surprisely about 54% and its trand grow positively higher and touch 90% of households. than remaining years 1980 to 2019 stayed 100% oh households. similary vacuum cleaner has only 30% of households than it number rose dramacally touch 90% by 1980. and reached 100% og households remaining years 2000 to 1019.
In second chart, people spent highest time that 50 hours per week by 1920. than graph drop sharply and owner spent 20 hours per week in 1960. in 1980 and 2000 owner spent around 15 hours per week. in 2019 its number drope lowest time spent over the period at only 10 housr per week.
AI examiner evaluation
| Criterion | Band |
|---|---|
| Task Achievement / Task Response | 6.5 |
| Coherence and Cohesion | 6.0 |
| Lexical Resource | 5.0 |
| Grammatical Range and Accuracy | 5.0 |
| Overall | 5.5 |
Task Achievement / Task Response: Band 6.5
You cover both charts and identify their central contrast: appliance ownership generally increased while weekly housework time declined. The response also includes useful comparisons, such as refrigerators reaching full ownership by 1980 and vacuum cleaners doing so later, and it reports the main stages in housework hours. This gives the account a solid overview, with relevant supporting figures. However, the overview contains a significant miscomparison: it says washing machines and refrigerators had the highest ownership while vacuum cleaners had the lowest, although refrigerators and vacuum cleaners both reached 100%, and washing machines remained lower. The claim that refrigerators had “no ownership” in 1920 also conflicts with the chart’s approximately 2%. To strengthen the response further, make the overview more precise and distinguish the appliances’ different end points and trajectories.
Coherence and Cohesion: Band 6.0
The response has a recognisable structure: an introduction, an overview, and separate paragraphs for the appliance data and housework hours. This makes the two charts easy to locate, and the chronological order generally helps the reader follow changes. However, progression within sentences is sometimes mechanical or unclear. Repeated links such as “after that,” “and,” and “than” do not always show the intended relationship, while the overview’s short fragments (“and the trends go down over the timeline”) interrupt the flow. Some references are also vague, as in “it number” and “remaining years.” Use complete overview sentences, group related appliance trends more deliberately, and choose precise links such as “whereas,” “by contrast,” and “thereafter” to clarify comparisons.
Lexical Resource: Band 5.0
You use relevant topic vocabulary, including “ownership,” “households,” “percentage,” “rose,” and “drop,” so the main trends can usually be understood. There are also attempts at more descriptive language, such as “drop sharply” and “rose dramatically.” However, the range and control are limited by repeated general wording and inaccurate collocations: “changes hands of electrical gadget,” “highest owner,” and “touch 90%” are not natural ways to describe the data. Spelling errors such as “surprisely,” “dramacally,” and “housr” also reduce precision. Build a bank of accurate chart language—“the proportion of households owning,” “reached,” “fell to,” and “levelled off”—and check spelling and word forms before submitting.
Grammatical Range and Accuracy: Band 5.0
You attempt both simple statements and longer sentences that connect several stages, for example the account of washing-machine ownership from 1920 to 2019. This shows some range, but many sentences contain errors in agreement, articles, tense, or sentence construction. Examples include “The given two charts illustrates,” “washing machine and refrigerator has,” and “it touch 60%”; these should use plural agreement or appropriate past-tense forms. Several clauses are joined without clear punctuation, and fragments such as “and the trends go down over the timeline” weaken control. Practise forming accurate past-tense comparisons and checking subject–verb agreement, then divide long sequences of figures into complete sentences. More consistently accurate sentence patterns would make the information easier to follow.
See this exact question answered at other band scores. The same prompt compared across bands.
Browse more IELTS Writing model answers or get your own writing scored by the same AI examiner.