Band 5.0 IELTS Writing Task 1 Model Answer
Overall Band Score: 5.0 · Cambridge IELTS 16 · 2026-11-21
IELTS Writing Task 1 question
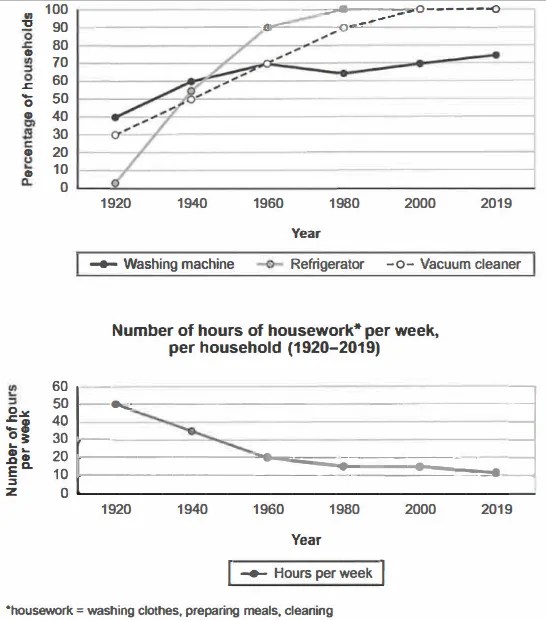
The charts below show the changes in ownership of electrical appliances and amount of time spent doing housework in households in one country between 1920 and 2019.
Summarise the information by selecting and reporting the main features, and make comparisons where relevant.
Percentage of households with electrical appliances (1920-2019)
Student answer (Band 5.0)
The graph charts shows the different choices of owning variety of electrical appliances washing machine, refrigerator, vacuum cleaner and spent times proportion doing housework in households from the time stamp between 1920 and 2019 in one country.
Overall, refrigerator and vacuum cleaner ownership percentage increases gradually over the time period where as the use of washing machine has a subtle high and low
rates of usage over the period.
Firstly, the usage of refrigerator has a massive increament from year 1920 to 1940 of around 55% and it increases double around 90% in 1960 and meet 100% in 1980 to rest of 2019.
Secondly, people already started using washing machine and vaccum cleaner in 40%
households where vaccum cleaner grows gardually over the time period but the usage of washing machine get slightly down in year between 1960 and 1980 and again it is increases gradually after 1980 to 2019 in around 70% over the period.
AI examiner evaluation
| Criterion | Band |
|---|---|
| Task Achievement / Task Response | 4.0 |
| Coherence and Cohesion | 5.0 |
| Lexical Resource | 5.5 |
| Grammatical Range and Accuracy | 5.0 |
| Overall | 5.0 |
Task Achievement / Task Response: Band 4.0
You identify the broad rise in refrigerator and vacuum-cleaner ownership and the slight fluctuation in washing-machine ownership, so the response is relevant to the charts. However, the coverage is only partial: the second chart, showing housework hours falling from 50 to 11 per week, is not reported at all, and there is no overview of this major trend. Some figures are also inaccurate or unclear: washing machines began at 40% and vacuum cleaners at 30%, not both at 40%; washing-machine ownership was about 70% in 1960 and 65% in 1980, rather than simply describing a slight fall between those years. Include both charts and select the main trends and key comparisons accurately.
Coherence and Cohesion: Band 5.0
The response has a basic structure, with an introduction, an overview and two body paragraphs, and sequencing words such as “Firstly” and “Secondly” help signal the order of points. However, progression is limited because the housework chart is omitted, leaving the account incomplete, and the body paragraphs do not develop a balanced comparison of the information. Some links are awkward or unclear, particularly “where as” and “but the usage of washing machine get slightly down.” Group related trends together and use clear references to the years and series; for example, compare the three appliances across the period, then describe the decline in housework hours. This would make the organisation more coherent and less dependent on basic sequencing markers.
Lexical Resource: Band 5.5
You attempt some task-appropriate vocabulary, including “ownership,” “gradually,” “increases” and “over the time period,” and the main subject is generally understandable. However, word choice and collocation are often inaccurate or repetitive: “different choices of owning variety” is unclear, “spent times proportion” does not describe the second chart naturally, and “massive increament” is an unsuitable and misspelled phrase for a measured rise. “Usage” is also repeated where “ownership” or “the proportion of households with…” would be more precise. Build a reliable set of trend expressions and use them accurately, such as “rose sharply,” “levelled off,” and “declined steadily.” Check spelling and word forms before submitting.
Grammatical Range and Accuracy: Band 5.0
You use a few longer sentence patterns, including clauses linked with “whereas,” “but” and “where,” and the reader can usually identify the intended trends. However, control is inconsistent, and errors frequently affect clarity. The opening, “The graph charts shows,” has subject–verb agreement problems and an awkward sentence structure. Other examples include “the usage … increases,” where tense should be consistent with the past period, and “it is increases gradually,” which has an incorrect verb form. Articles and sentence boundaries are also unreliable, as in “in year between 1960 and 1980.” Practise accurate past-tense reporting and simple comparative sentence patterns first, then add complex clauses only when their grammar is secure.
See this exact question answered at other band scores. The same prompt compared across bands.
Browse more IELTS Writing model answers or get your own writing scored by the same AI examiner.