Band 5.0 IELTS Writing Task 1 Model Answer
Overall Band Score: 5.0 · Cambridge IELTS 16 · 2026-11-22
IELTS Writing Task 1 question
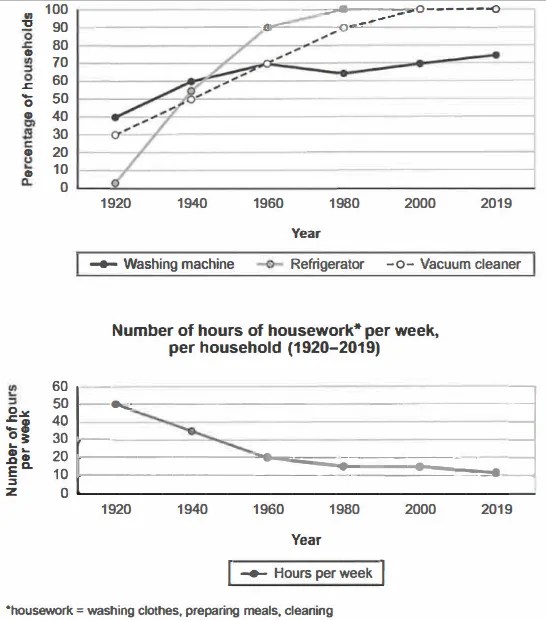
The charts below show the changes in ownership of electrical appliances and amount of time spent doing housework in households in one country between 1920 and 2019.
Summarise the information by selecting and reporting the main features, and make comparisons where relevant.
Percentage of households with electrical appliances (1920-2019)
Student answer (Band 5.0)
The charts illustrates the mordify in ownership of eleteical appliance and the figure of time spent doing housework in one country between 1920 and 2019.
The main change on this charts is Refrigerator this sector of housework are not a site. If we see this charts this rate are not low around the full grapg. Wheh it is started to growing its don't stop. On 1920 started to increase and end to increase 1980 fristly its rate was 0 but lastly 100 persentage of household.
If I talk about the washing machine sectore are started in 1920 and the rate was only 40 persent,after 40 years it's increase some few around 30 persent. Suddenly, it is down and came 61 persent in 1980. And after 2000 decade and 2019 year the rate was grow only 10 persent. The other main point is Vacuum cleaner this sector donot came down its started 1920 with 30 persent and stop in 2000 with the rate was 100 persent. The other site is housework per week, in 1920 the worker work 50 hours per week. After 40 years its started to grow down and came up 20 hour. Lastly, in 2019 its only 10 hours which is very low.
AI examiner evaluation
| Criterion | Band |
|---|---|
| Task Achievement / Task Response | 5.5 |
| Coherence and Cohesion | 5.0 |
| Lexical Resource | 4.5 |
| Grammatical Range and Accuracy | 4.5 |
| Overall | 5.0 |
Task Achievement / Task Response: Band 5.5
You cover all four series and identify several broad trends, including the rise in refrigerator ownership, the increase in vacuum-cleaner ownership, and the fall in housework hours. However, the overview is unclear: “The main change on this charts is Refrigerator” does not summarise the overall pattern across the charts. Some figures are also inaccurate or confusing. Refrigerator ownership began at about 2%, not 0%, and reached 100% in 1980; washing-machine ownership rose from 40% to 60% by 1940, rather than increasing by “some few around 30 percent.” The claim that it reached 61% in 1980 is also incorrect; it was about 65%. To strengthen the response, give a clear overview and report the main comparisons accurately, including the steady decline in housework time.
Coherence and Cohesion: Band 5.0
The response has some organisation: it moves from refrigerators to washing machines, vacuum cleaners and housework, so the reader can identify which series you are discussing. However, there is no clear overall progression from an introduction to a concise overview and then supporting details. Several linking phrases are repetitive or unclear, such as “If we see this charts,” “The other main point,” and “The other site.” Some sentences also combine several stages without clear relationships, making the timeline difficult to follow. Use separate paragraphs for an overview and the detailed comparisons, and connect changes with precise time markers such as “by 1940,” “after a slight dip,” and “by 2019.” Clearer referencing would also help readers follow each trend.
Lexical Resource: Band 4.5
You use some relevant chart vocabulary, including “rate,” “increase,” “housework,” and “per week,” and you attempt to describe changes over time. However, the range is limited and several word choices or spellings make the meaning difficult to understand: “mordify,” “eleteical appliance,” “sectore,” and “grapg.” Phrases such as “started to grow down” and “this sector of housework are not a site” are not natural ways to describe the data. Aim for accurate, conventional terms for trends and ownership, and check spelling carefully. Replacing vague expressions such as “very low” with a specific comparison would also make your descriptions more precise and appropriate for an academic report.
Grammatical Range and Accuracy: Band 4.5
You attempt to form longer sentences and use time clauses, but the range of structures is limited and errors are frequent enough to make some sentences difficult to interpret. For example, “The charts illustrates” has subject–verb disagreement, while “this rate are not low” has an incorrect verb form and unclear sentence structure. Tense and clause construction are also problematic in “After 40 years its started to grow down and came up 20 hour.” Articles, plurals and punctuation are inconsistent, as in “the washing machine sectore are started” and “40 persent,after.” Practise writing short, complete sentences with a clear subject and verb, then combine them using accurate clauses. Check agreement, past-tense forms and sentence boundaries during revision.
See this exact question answered at other band scores. The same prompt compared across bands.
Browse more IELTS Writing model answers or get your own writing scored by the same AI examiner.